Dr. Priyadharshini J
Learner of Mathematics
Dr. Priyadharshini J, a passionate learner and educator, envisions this platform as a gateway for students to embrace learning in mathematics. With a focus on building confidence and sharpening skills, this site is dedicated to guiding math aspirants in their journey to crack competitive exams and achieve their academic dreams.
TILIN’s Maths Class
To Join Online Class:
Resources for School Level
Competitive Examinations


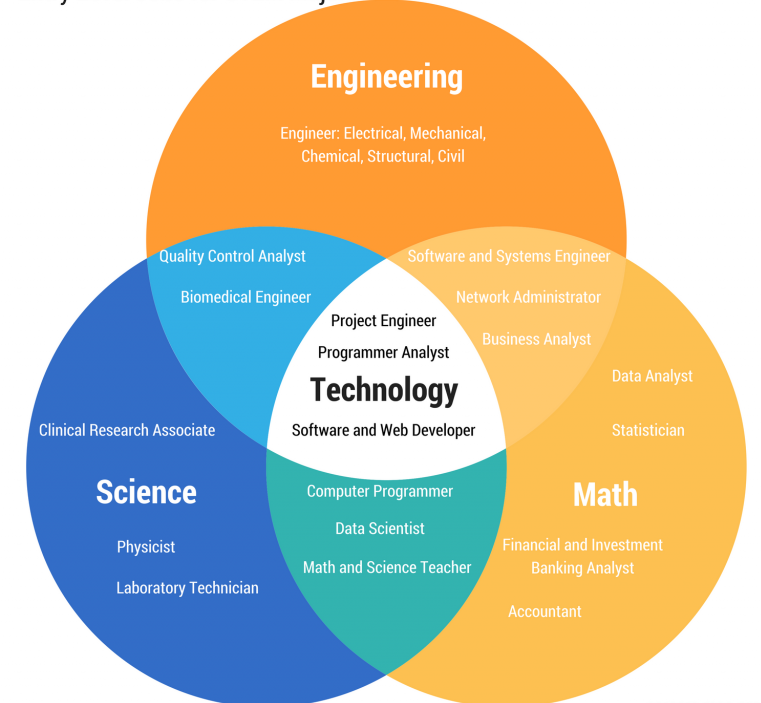
Mathematics Career Oppertunities


“An equation for me has no meaning unless it expresses a thought of God” “To preserve my brains I want food and this is now my first consideration”
Srinivasa Ramanujan
Our sister concerns

Fancy & Stationary Stores
Kalipatti, Trichy Main Road, Thuraiyur, Trichy District, Tamil Nadu – 621014
Tilin’s Maths Class
Maths tutor online, handling classes for all school grades.